
Mapping Vulnerability
In the first of a regular series on Analysis in Practice, Police Professional looks at how the Wigan Community Safety Team and Greater Manchester Police expanded on the Vulnerable Localities Index to extend and improve their use of mapping crime to include other factors such as socio-economic data.
In the first of a regular series on Analysis in Practice, Police Professional looks at how the Wigan Community Safety Team and Greater Manchester Police expanded on the Vulnerable Localities Index to extend and improve their use of mapping crime to include other factors such as socio-economic data.
In 2005, the Jill Dando Institute (JDI) and the National Centre for Policing Excellence (NCPE) responded to the UK National Policing Plans call for the promotion of community cohesion to be central to the work of the police, recognising that the police role in community cohesion is to help bring stability, order and be more proactive in preventing crime.
To fulfil this role there was a need to better understand where police resources should be targeted to have long-term impact, both in terms of preventing crime and supporting the prevention of community fragmentation.
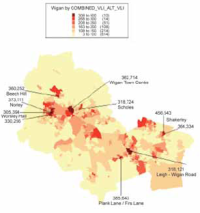
Using geographical datasets and indicators, vulnerable localities which experienced significant or disproportionate criminality, fear, disorder or tensions were identified, to create a Vulnerable Localities Index (VLI).
With neighbourhood policing being rolled out across the country, the VLI, which aims to lead a proactive policing involvement in regeneration initiatives, effective partnership working and intelligence-led policing, is seen by many as an obvious asset to strategic policing.
Building on the work of the pilot projects and taking that initial platform to another level is the Greater Manchester Against Crime (GMAC) Strategic Analyst, working in conjunction with Wigan Community Safety Research and Information Team.
Ian Bullen has been involved in the development of crime mapping techniques and data collecting of Priority Neighbourhoods. The VLI was born initially out of a police response to the race riots in 2001 in Burnley, Oldham and Bradford, he explained. It was designed to test the theory of predicting where such incidents would happen again, a simple but robust method of identifying neighbourhoods that were threatened by a lack of cohesion.
Now the VLI is a much wider tool and doesnt only deal with incidents that come out of minority and racial issues. The factors which the VLI scans for now consist of employment deprivation, social deprivation and broader areas such as educational obtainment.
It was the central input from GMAC that provided the initial VLI data, using six indices in the mapping process. This was then rolled out to each of the boroughs before being developed further.
Ian Bullen described how the partnership added to the initial six indices: We presented the initial findings at strategic meetings, and we were met with the question, Here is the evidence but are these really the right places/priority neighbourhoods? As a result we developed a separate set of indices that we felt measured these things from a slightly different angle, which strongly backed up the VLI.
A strong correlation between the two sets of indices confirmed the stated aim and also provided additional descriptive data that could be used in analysing local areas. Further work was then commissioned because, despite a reduction in crime Borough-wide, the highest Priority Neighbourhoods had actual seen an increase the gap was widening between them and the rest of the Borough.
The additional indices added were sourced from a variety of areas. They involved information from the fire service incident data, specific to incidents which are more likely to be crimes rather than general house fires; census information, focusing on single parents with dependant children; health deprivation; probation client records and violence in a domestic setting taken from police data.
Original Six Indices
Crime data
Burglary in a dwelling
Criminal damage in a dwelling
Deprivation data
Income deprivation
Employment deprivation
Education data
Educational attainment below 5 G